

A single TA thread on GJ would be implemented from now on.
2 posters
----GBPJPY----

Rd- Admin
- Posts : 600
Join date : 2009-05-25
Age : 37
Rd- Admin
- Posts : 600
Join date : 2009-05-25
Age : 37

Rd- Admin
- Posts : 600
Join date : 2009-05-25
Age : 37
GJ seems to be on wave 2 of the elliot wave,
Best not to trade now?

Best not to trade now?
Rd- Admin
- Posts : 600
Join date : 2009-05-25
Age : 37
GJ inches upwards.

Rd- Admin
- Posts : 600
Join date : 2009-05-25
Age : 37

Rd- Admin
- Posts : 600
Join date : 2009-05-25
Age : 37
Head and shoulders working it's magic.

Rd- Admin
- Posts : 600
Join date : 2009-05-25
Age : 37
What would GJ's direction be?
Comments:
-Many states Jpy will head downwards due to the utilization of carry trade on JPY. << SHORT
-In the H1 window, GJ appears to be reaching a low set last week. Would the support break? Or would it jump back up? How would the big players react? << ?
Shaz could you show some pictures on GJ's fib lines please?
Rd- Admin
- Posts : 600
Join date : 2009-05-25
Age : 37
I expect the price of GJ to be go sideways from now till tomorrow, due to people buying the USD. USD is going back up, and GBP and JPY will take turns to gain against the USD, causing a ranging phenomenon for GJ. (talking a lot of crap. haha)

niea- Forex Donators
- Posts : 506
Join date : 2009-05-26
GJ been sideway today...
I draw this fib line this morning on 60mins chart (green line)
those purple line drawn on 2/9/09
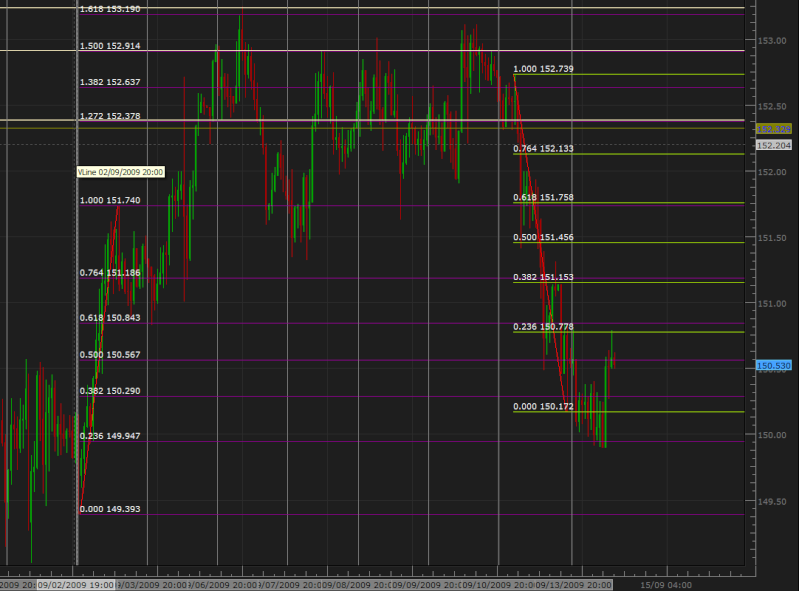
I can't see clear pattern yet...
The highest it can go for today most likely around 151.30 - 151.75
but I'm more bias for downward movement...
downward I'm targeting at level
149.191 (-0.382 fib)
148.585 (-0.618 fib)
146.912 (-1.27 fib) most extream
another thing, 150 is important psychological level...maybe can expect some suppport there...
I draw this fib line this morning on 60mins chart (green line)
those purple line drawn on 2/9/09
I can't see clear pattern yet...
The highest it can go for today most likely around 151.30 - 151.75
but I'm more bias for downward movement...
downward I'm targeting at level
149.191 (-0.382 fib)
148.585 (-0.618 fib)
146.912 (-1.27 fib) most extream
another thing, 150 is important psychological level...maybe can expect some suppport there...
Rd- Admin
- Posts : 600
Join date : 2009-05-25
Age : 37
Good news coming from the Brits this morning, which somehow leads me to believe that for this week, GJ might actually continue uptrend. I have a feeling more good news might appear from the Brits, leading GU, GJ to progress upward.
UJ meanwhile begins maintaining a horizontal alignment, moving sideways.
GU:

UJ:

GJ:

UJ meanwhile begins maintaining a horizontal alignment, moving sideways.
GU:
UJ:
GJ:
Rd- Admin
- Posts : 600
Join date : 2009-05-25
Age : 37
Forecasts for GBP CPI says inflation might go down... ie GBP goes down.... yet direction wise for GJ it heads up...
people are getting confused now.
people are getting confused now.
Rd- Admin
- Posts : 600
Join date : 2009-05-25
Age : 37
Shaz, do u feel recently GJ has been very slow moving... like inching around... with very little pip movement? I recently start to get irritated by GJ which moves so little. Or is it the entire market is slowing down?
niea- Forex Donators
- Posts : 506
Join date : 2009-05-26
yea, you are right... GJ been slow moving lately...
moving in tight range
the only action you can see is around 2-5pm & 7-10pm
did you just change the outlook of this forum?
moving in tight range
the only action you can see is around 2-5pm & 7-10pm
did you just change the outlook of this forum?
niea- Forex Donators
- Posts : 506
Join date : 2009-05-26
At the moment, 2pm... yen weaken drag pound and euro down
hope GJ will stop at 149.0x again before reverse up
but frm 60 mins chart, saw candle just breakout towards lower BBand
hope GJ will stop at 149.0x again before reverse up
but frm 60 mins chart, saw candle just breakout towards lower BBand
Rd- Admin
- Posts : 600
Join date : 2009-05-25
Age : 37
A bounce was seen against the downward channel in GJ.

Rd- Admin
- Posts : 600
Join date : 2009-05-25
Age : 37
GJ might be heading upwards for a while... might not be much in terms of pips though.
macd saying it might be time to long.
I must add, do await for the candle to bounce off the white SMA line, before attempting to long.
macd saying it might be time to long.
I must add, do await for the candle to bounce off the white SMA line, before attempting to long.
Last edited by Rd on Tue Sep 29, 2009 3:19 pm; edited 1 time in total
niea- Forex Donators
- Posts : 506
Join date : 2009-05-26
I don't hv my chart with me in office....
but I was thinking for GJ 60min charts (Elliot wave)
wave 1 (140.292 - 142.842) 1.0 fibo line
maybe extend to 1.27 fibo line until 143.5305
if GJ moves until 144.4179 (1.618 fibo line) then I'm wrong about this... it means it's not wave 1
but if GJ come down until 141.8679 (0.618 fibo line) or 141.2661 (0.382 fibo line) and reversal up until 144.4179 (1.618 fibo line)
then it create wave 2 and wave 3...
the most extream GJ would be down until 139.3179 (-0.382 fibo line) or 138.7161 (-0.618 fibo line)
not sure this is correct or not....
Last edited by niea on Tue Sep 29, 2009 3:22 pm; edited 1 time in total
Rd- Admin
- Posts : 600
Join date : 2009-05-25
Age : 37
wah how do you identify whether it's "Wave 1" or not?
f GJ moves until 144.4179 (1.618 fibo line) then I'm wrong about this
niea- Forex Donators
- Posts : 506
Join date : 2009-05-26
How I identify it's wave 1 hmm....
I also don't know...this one need to guess
for this one, I saw already have 5 wave down so start new wave up
not sure it will be big wave or small wave...
that's why need to test/monitor first whether it wave 1/2 or not...
I think in my previous post I've mentioned about EW rules combine with fibo line...
wave 1 = 1.0
wave 2 = wave 1 x 0.618
bla...bla...
so if GJ move higher than 144.4179 then my counting is wrong already
I need to recount again and test again...
so far this is the only way I know to use EW...
there are many other ways to use it...
regarding ur comment:
although ema line crossing showing it's going up...
but CCI line moving down towards below +100 (but not yet cross below +100)
and RSI also just hovering below 70
not so strong sign I think... well I might be wrong for all my EW theory ha..ha..
but I think we learn together...
today lesson about CCI:
How to use CCI
Here is the author's advice on the work with the CCI index in case it moves above +100 and below-100 and sends sell or purchase signals. Buy or sell signals happen 20 - 30 % of the time while from 70 up to 80 % of time Commodity Channel Index's value is fluctuating between +100 and -100. It's supposed that if CCI overcomes the level of +100 from below upwards, it means that the currency pair is moving in the direction of the strong ascending trend, thus there is a clear purchase signal. And once CCI goes under +100 the position is supposed to be closed on a return signal. At the same time, it's considered that if Commodity Channel Index moves to -100 point from top to down, it means that the currency pair is meeting a strong descending trend, and there's a sale signal. As soon as CCI again crosses the level of -100 this position is considered closed.
Later CCI started to work for determining if market is overbought or oversold, for definition of reversal points. The currency pair is considered overbought once it overcomes +100 level and is oversold once CCI goes under -100 point. While CCI stays in an overbought position which is above +100, the sale signal appears in case if CCI crosses a level +100 in the opposite direction - from the peak to the bottom. After CCI has entered into an oversold zone which is under -100 level, the purchase signal appears when CCI crosses -100 point in the opposite direction - from the bottom to the peak.
and don't forget about FA...
- DJIA gains last night this may caused FTSE also want to gains today... seeing from Future FTSE strong green
- GBP GDP news release!!! another thing to watch for...
Rd- Admin
- Posts : 600
Join date : 2009-05-25
Age : 37
haha im trying to adapt a new theory i've seen on forexfactory.. go and search; "Simple Pips Generating Machine" which identifies the usage of the macd line... so im testing it first.
niea- Forex Donators
- Posts : 506
Join date : 2009-05-26
ok, don't forgot to update here...
niea- Forex Donators
- Posts : 506
Join date : 2009-05-26
Just arrived home....
I try login to fxcm acc got the same error as yours...
tried 4 - 5 times then only can login
this the chart with fibo line
seems like when GJ going down, it's not so much.... barely touch 0.618 fibo line at 141.868 (lowest at the moment is 142.038) slightly missed around 15-20 pips
still moving in tight range 142 - 143 so waiting it to move to 141 or 144 to complete today movement...

normal candle, not so strong signal also with RSI & CCI looks like going to be week...

I try login to fxcm acc got the same error as yours...
tried 4 - 5 times then only can login
this the chart with fibo line
seems like when GJ going down, it's not so much.... barely touch 0.618 fibo line at 141.868 (lowest at the moment is 142.038) slightly missed around 15-20 pips
still moving in tight range 142 - 143 so waiting it to move to 141 or 144 to complete today movement...
normal candle, not so strong signal also with RSI & CCI looks like going to be week...
Rd- Admin
- Posts : 600
Join date : 2009-05-25
Age : 37
hmm.. i found a solution.. which requires changing the proxies. finally it works.. hah... wasted my 1 day of trading!!! i expect GJ to be slow now..... current focus on EU (but not so now, I expect a change in trend direction soon), and UJ.
Rd- Admin
- Posts : 600
Join date : 2009-05-25
Age : 37
doesn't really work well too.. i suspect streamyx is having problems in the connection to the UK/US... hmm..
Rd- Admin
- Posts : 600
Join date : 2009-05-25
Age : 37
GJ is inching it's way slowly upwards... Too slow to be deemed as profitable to me.. Though it might be a pretty long term "slow" uptrend though.
GJ did manage to bounce of the SMA line before heading upwards in this picture. Could've caught some pips there

GJ did manage to bounce of the SMA line before heading upwards in this picture. Could've caught some pips there